Answer the following questions to get familiar with the graphs:
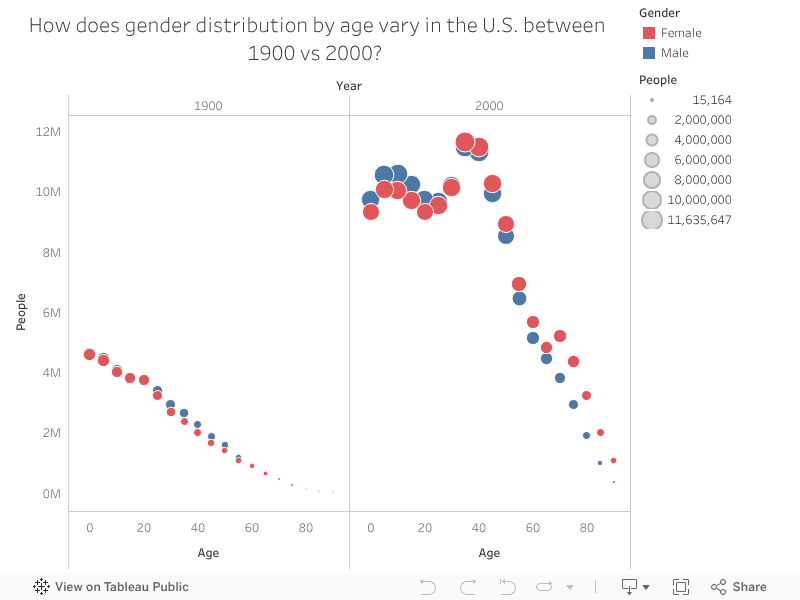
1. Which age group had the highest population for 1900 and for 2000?
2. What is the population for the 40 year old age group from 1900 vs. 2000?
3. From the year 2000 data, between the age groups 35-90, which gender has the highest population?
3. What type of trend do you notice about both gender population in the year 1900?
1. Age 0 has the highest in 1999 and age group 35 has the highest population in 2000. There is no age group having the highest in both year.
ReplyDelete2. Age 45 female.
3. Not the same gender, but the same age.
4. Majority of age group of male has higher population than the female. Both has down trend.
Question 1 gives me the most interactive activities with the graph. I'm confused about how to compare with them. 2 and 3 are simple easy question to answer. The visualization definitely facilities the communication. Because of that, I can easily tell the trend.
1.There is no one age group having the highest population in both years. In 1900, age 0 has the highest population. In 2000, age 35 has the highest population. The population of age 35 in 2000 is higher than the population of age 0 in 1900.
ReplyDelete2.Female has the highest population after age 40.
3.No, it did not have the same result. Male has the highest population after age 40.
4.In the most of age ranges, the male population is larger than female population in the year 1900. In addition, the overall trend of population decreases linearly.